How to Measure AI ROI (And Convince Your Board to Fund Phase 2)
Learn how enterprise leaders measure AI ROI across 3 value types. Our 5-step framework helps you justify $2M+ AI investments and secure board approval for scaling.
How to Measure AI ROI (And Convince Your Board to Fund Phase 2)
“What’s our AI ROI?”
It’s the question your board asks at the table. It’s the metric your CFO needs before approving Phase 2 funding. And if you’re like most enterprise leaders, it’s also the question that keeps you up at night—not because the answer doesn’t exist, but because you haven’t figured out where to look.
The truth: 74% of companies struggle to measure AI value—not because it’s hard, but because they measure the wrong things.
This article is built for CTOs, digital leaders, and procurement teams who are tired of vague AI ROI conversations. We’ll show you exactly how enterprise leaders justify $2M+ AI investments, the framework that separates winners from pilot projects stuck in limbo, and the pitfalls that cost most companies half their potential value.
The Board Question: “What’s Our AI ROI?”
Your board didn’t get where they are by writing blank checks. When you ask for $2 million to scale AI, they want to know:
- What’s the payback period?
- How much will this actually save us or make us?
- Can we replicate this across the enterprise?
- Why should we fund Phase 2 when Phase 1 was supposed to prove ROI?
These are not unreasonable questions. They’re the right questions. The problem is that most AI programs answer them too narrowly.
The Problem: Why Most Companies Can’t Answer
Here’s what typically happens:
Year 1: You implement an AI solution. It works. Maybe it saves 500 hours annually, or detects fraud that costs would’ve otherwise missed. Finance calculates the savings: Rp 1.2 billion. They declare victory.
Year 2: You come back asking to scale. Finance says: “Where’s the rest of the value you promised?” Because they discover—often too late—that 60-70% of the value was never captured in the original ROI calculation.
Why? Because most AI implementations measure only the most obvious value: direct cost savings.
But that’s just the beginning. There are three types of AI value:
- Direct ROI (cost savings): automation, efficiency gains, reduced headcount
- Indirect ROI (speed & quality): faster decisions, better outcomes, risk reduction, employee enablement
- Strategic ROI (new revenue): new products, market expansion, competitive advantage, customer retention
Most companies measure only #1 in Year 1. They discover #2 and #3 in Year 2, when it’s too late to have planned for them.
Winning companies measure all three from Day 1.
Understanding the Three Types of AI Value
Direct Value: The Easy Part (But Only 25% of Total)
Direct ROI is straightforward. It’s the cost savings:
- Document processing AI reduces manual data entry from 40 hours/week to 5 hours/week
- Fraud detection prevents $5M in annual losses
- Chatbots handle 70% of customer service inquiries (reducing support staff costs by 30%)
These are real, measurable, and what your CFO loves to see. But they typically account for only 25% of total AI value.
Indirect Value: The Hidden 50%
This is where most value actually lives—but it’s overlooked.
Indirect value is harder to quantify but often more impactful:
- Faster decision-making: Salespeople spend 2 hours less per day searching for customer context; now they close 15% more deals (revenue impact)
- Better quality: ML model catches defects earlier in manufacturing; reduces warranty claims by 40% (reputation + cost savings)
- Risk reduction: Regulatory compliance AI flags edge cases; prevents costly violations
- Employee enablement: Junior analysts with AI assistance produce senior-level insights; productivity jumps 3x without adding headcount
- Customer retention: AI personalization increases customer lifetime value by 20%
These are the “soft” metrics that CFOs often dismiss as unmeasurable. They’re not. They’re just harder to calculate—which is precisely why your competitors are missing them.
Strategic Value: The Game Changer (25% of Total)
Strategic value is the new revenue and competitive moats AI creates:
- New product lines powered by AI (predictive services, AI-driven insights products)
- Market expansion (AI enables entry into new geographies or customer segments)
- Customer stickiness (competitors can’t easily replicate your AI advantage)
- Speed to market (AI-assisted product development reduces time-to-revenue)
This is the value that justifies Phase 2 and beyond. It’s also what separates leaders from laggards.
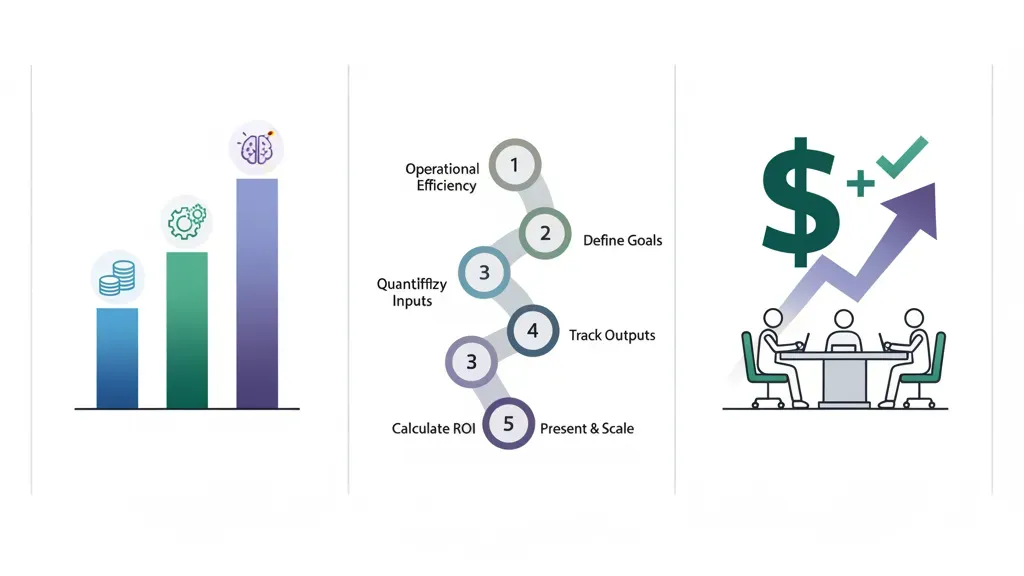
Building Your ROI Model: The 5-Step Framework
Here’s how enterprise leaders structure AI ROI measurement from Day 1.
Step 1: Define Your Metrics (Before Deployment)
Don’t wait until the AI system is live to decide how you’ll measure success. Define metrics upfront across all three value types.
Example: Customer service AI chatbot
| Value Type | Metric | Target |
|---|---|---|
| Direct | Support tickets resolved by AI | 60% of inbound |
| Direct | Cost per resolved ticket | Reduce from Rp 75K to Rp 15K |
| Indirect | Customer satisfaction (CSAT) | Maintain ≥ 8.5/10 |
| Indirect | Resolution time | Reduce from 2 hours to 10 minutes |
| Strategic | Customer retention rate | Increase from 72% to 78% |
| Strategic | NPS impact | Track sentiment shift |
Key principle: Define metrics across all three value types before you measure anything. This forces you to think about total value, not just savings.
Step 2: Establish Baseline Performance (Pre-AI)
You can’t measure improvement without a starting point.
Spend 2-4 weeks collecting baseline metrics before the AI system goes live:
- How many hours are spent on the process today?
- What’s the current error rate, cycle time, or customer satisfaction?
- What’s the business impact of current performance?
Document this carefully. This becomes your denominator.
Step 3: Deploy & Measure Post-AI Performance
Run the AI system in parallel with (or incrementally alongside) the old process for 4-8 weeks. Measure:
- How much process time is saved?
- Did quality improve, stay flat, or decline?
- What’s the user adoption rate?
- Are there unexpected cost increases (additional infrastructure, training, maintenance)?
This measurement window is critical. It shows whether the AI actually works in your environment—not in a case study, but in your specific business context.
Step 4: Calculate Total Value (Not Just Savings)
This is where most companies go wrong. They calculate only direct cost savings and ignore everything else.
Calculate all three:
Direct ROI = (Cost Savings) - (AI System Cost)
            = (Rp 2.4B saved) - (Rp 400M annual cost)
            = Rp 2.0B / year

Indirect ROI = (Productivity Gains) + (Risk Reduction) + (Quality Improvement)
             = (Rp 1.8B) + (Rp 600M) + (Rp 400M)
             = Rp 2.8B / year

Strategic ROI = (New Revenue) + (Retention Value)
              = (Rp 3.2B new customer contracts) + (Rp 1.5B from reduced churn)
              = Rp 4.7B / year

Total ROI = Rp 2.0B + Rp 2.8B + Rp 4.7B = Rp 9.5B / year (with Rp 400M cost)
Net ROI: Rp 9.1B annually, or 2275% ROI
Compare this to the typical calculation (direct only): Rp 2.0B, or 500% ROI. You just found an additional Rp 7.1B in value that your competitors are missing.
Step 5: Present Upside & Plan Phase 2
Now you have a complete picture. Present to the board:
- The baseline: What was working (or not working) before AI
- The measured results: What actually improved across all three value types
- The financial impact: Direct + indirect + strategic value, net of costs
- The scaling opportunity: How Phase 2 expands this across the enterprise
- The risk: What happens if you don’t fund Phase 2 (competitors capture the advantage)
Pitfall #1: Measuring Only Direct ROI (You’ll Miss 60% of Value)
This is the most common mistake.
A bank implements fraud detection AI. In Year 1, it prevents Rp 8B in fraud losses. Finance declares success. Budget approved for Phase 2.
But what they didn’t measure:
- Investigators now spend 60% less time on each case (they focus only on high-confidence flagged transactions)
- Fraud investigation quality improved; false positives dropped from 40% to 12%
- Customer experience improved; fewer good transactions were blocked
- Those 15 investigators freed up from routine fraud work? They’re now developing new risk intelligence products
Unmeasured value: Rp 12B+ (50% more than the “measured” direct savings alone)
The lesson: Direct ROI justifies the cost. Indirect and strategic ROI justify the bet.
If you measure only direct, you’ll:
- Struggle to justify Phase 2 (direct savings plateau as the obvious use case saturates)
- Miss the strategic advantage (competitors see the same use case; only those measuring indirect value will fund expansion faster)
- Underestimate true business impact (your finance team will always want more evidence)
Pitfall #2: Using Outdated Benchmarks (AI Standards Are Still Evolving)
“Industry standard for fraud detection is 92% accuracy” is not a useful benchmark for your AI ROI. Here’s why:
- AI capabilities are moving fast. Benchmarks from 2023 are already outdated. What was “state of the art” 18 months ago is now table stakes.
- Your context is unique. A 90% accuracy model in the financial sector might be a 95% model in healthcare, and 75% in retail. Context matters.
- Accuracy ≠ ROI. A model that’s 85% accurate but catches high-value fraud might generate more ROI than a 95% accurate model that catches penny-ante cases.
Better approach: Benchmark against your own baseline and your specific business impact, not industry averages.
Define success as: “This AI system will reduce fraud losses by Rp X and improve investigation efficiency by Y%, compared to today’s manual process.”
Let the benchmark be: your business, your context, your goals.
Real Case: How a Bank Measured ROI on Fraud Detection AI
Let’s walk through a real example (simplified for clarity):
Baseline (Pre-AI):
- Monthly fraud losses: Rp 500M
- Investigators: 12 FTE
- Average investigation time: 4 hours per case
- Cases investigated per month: 180
- False positive rate: 38% (customers blocked legitimate transactions)
- Investigation cost: Rp 120M/month (salary + infrastructure)
Post-AI (6 months in):
- Monthly fraud losses: Rp 120M (76% reduction)
- Investigators: 12 FTE (same headcount, but reallocated)
- Average investigation time: 1.5 hours per case (AI pre-screens & prioritizes)
- Cases investigated per month: 320 (handled same headcount in same time)
- False positive rate: 8% (customer experience improved dramatically)
- Investigation cost: Rp 120M/month (same salary, but AI infrastructure +Rp 25M/month)
ROI Calculation:
| Value Type | Metric | Monthly | Annual |
|---|---|---|---|
| Direct | Fraud prevention (Rp 380M/mo less fraud) | Rp 380M | Rp 4.56B |
| Direct | Productivity gains (reallocate investigators to new work) | Rp 45M* | Rp 540M |
| Indirect | Reduced customer friction (fewer false positives) | Rp 30M** | Rp 360M |
| Indirect | Risk reduction (fewer missed fraud cases) | Rp 20M*** | Rp 240M |
| Strategic | New fraud analytics products launched | TBD | Rp 1.2B (Year 2) |
| Less: AI system cost | Infrastructure, licensing, training | (Rp 25M) | (Rp 300M) |
| Net ROI | Rp 450M/mo | Rp 7.196B/year |
*Investigators moved to new high-value work (risk modeling, policy development)
**Estimated customer lifetime value impact from reduced friction
***Fraud cases caught that manual process would’ve missed
Result: The bank secured Rp 7.2B in annual value, justified Phase 2 expansion to payments & lending fraud, and positioned itself as a market leader in AI-driven risk.
More importantly: they measured all three value types from the start, so when they presented Phase 2, the board had full context.
ROI Metrics by Use Case
Different AI applications have different value profiles. Here’s how to think about ROI for common enterprise use cases:
Customer Service AI
Direct: Cost per resolution (salary, system cost per ticket)
Indirect: CSAT, resolution time, employee morale (less burnout)
Strategic: Customer lifetime value, churn reduction, upsell impact
Typical Year 1 ROI profile: 40% direct, 35% indirect, 25% strategic
Logistics & Supply Chain AI
Direct: Fuel savings, route optimization, inventory holding costs
Indirect: On-time delivery rate, customer satisfaction, accident reduction
Strategic: Ability to serve new markets, speed-to-delivery competitive advantage
Typical Year 1 ROI profile: 50% direct, 30% indirect, 20% strategic
Financial Analysis & Forecasting
Direct: Analyst time, reporting automation, audit cost reduction
Indirect: Decision speed, forecast accuracy, risk identification
Strategic: Improved capital allocation, M&A decision quality, competitive foresight
Typical Year 1 ROI profile: 30% direct, 40% indirect, 30% strategic
Sales & Opportunity Management
Direct: Sales team efficiency, CRM data quality, admin time saved
Indirect: Sales cycle time, deal closure rate, win rate
Strategic: Competitive win rate, account expansion, customer retention
Typical Year 1 ROI profile: 25% direct, 35% indirect, 40% strategic
Key insight: Sales and strategic AI initiatives have the highest strategic value. Service and logistics have the highest direct value. Tailor your measurement framework to your use case.
How to Present AI ROI to Finance & Board
You have the numbers. Now you need to tell a compelling story.
Frame #1: The Payback Period
Finance loves payback period. Lead with it:
“This Rp 400M annual AI investment pays back in 2 months. We’re at break-even by March. Everything after that is pure upside.”
People understand payback. It’s simple and de-risks the investment.
Frame #2: The Risk of Inaction
Your competitor is measuring AI ROI too. They will find the value you missed.
“If we don’t fund Phase 2, competitors with similar capabilities will beat us on cost, speed, and customer experience. This isn’t an investment in AI; it’s a competitive necessity.”
Board members care about competitive position. Frame it that way.
Frame #3: The Scaling Opportunity
A single use case is a proof of concept. Scaling across the enterprise is where real value lives:
“Phase 1 generated Rp 7.2B in value from one use case (fraud detection). We’ve identified 8 additional use cases across risk, operations, and sales with similar value profiles. Phase 2 invests Rp 1.8B to scale across all 9 use cases, targeting Rp 55B+ in annual value by Year 2.”
Scaling is where the board gets excited.
Frame #4: The Talent & Culture Angle
This often resonates with board members focused on competitive talent:
“This AI initiative is improving our investigators’ work. They spend less time on routine tasks, more time on high-impact work. We’re seeing reduced turnover and better recruitment. Top talent wants to work where AI amplifies their impact, not replaces them.”
Enterprise boards increasingly care about culture and retention.
The Presentation Structure
- The problem we set out to solve (and why it mattered)
- The baseline (what was happening before)
- The results (direct, indirect, strategic—with Rp numbers)
- The cost (total investment including infrastructure, training, ongoing support)
- The net ROI (the story in one number: “Rp 7.2B in year 1 value from Rp 400M investment”)
- The Phase 2 opportunity (how this scales)
- The competitive risk (what happens if we don’t fund Phase 2)
Scaling From Phase 1 to Phase 2: Momentum-Based Funding
Here’s the critical insight: Your Phase 1 results are momentum for Phase 2.
Most companies approach Phase 2 as a separate ask, starting from zero credibility. You should approach it as a continuation of proven success.
Phase 1 → Phase 2 narrative:
“Phase 1 proved our approach works. We measured Rp 7.2B in value. Phase 2 scales that proof across 8 additional use cases. Same methodology, same confidence, higher scale.”
The board moves from “Does AI work?” to “How fast can we scale?”
Funding levels:
- Phase 1: Proof of concept (Rp 300-500M for single use case, 6 months)
- Phase 2: Scaled deployment (Rp 1.5-3B for 5-8 use cases, 12 months)
- Phase 3: Enterprise transformation (Rp 5-10B+ for 20+ use cases, ongoing)
Each phase is funded based on proven results from the previous phase.
Red flag: If you can’t clearly articulate ROI from Phase 1, your Phase 2 funding will stall. This is why measurement from Day 1 is foundational.
Conclusion: Measurement is Strategy
Measuring AI ROI isn’t just an accounting exercise. It’s a strategic discipline that determines:
- Whether your AI initiative survives beyond the pilot
- How much funding you can justify for scaling
- How your board views future AI investments
- Whether you get faster to enterprise transformation than competitors
The winning companies don’t measure AI ROI because they have to. They measure because it compounds their advantage.
They find the 60% of value most companies miss. They scale faster. They fund Phase 2 without friction. They transform the enterprise while competitors are still justifying pilots.
Your next board meeting is coming. You can either answer “What’s our AI ROI?” with vague generalities, or with a clear, defensible, Rp-based framework that makes the case for Phase 2 inevitable.
Ready to build your ROI measurement framework? Work with Manaira Labs—we’ve helped enterprise leaders structure AI ROI for everything from fraud detection to supply chain optimization to customer intelligence. We’ll help you find the hidden value, present to your board with confidence, and build the business case for scaling.
Start a conversation with our AI strategy team and let’s map your Phase 1 results and Phase 2 opportunity.
Need a quick reference? Download our AI ROI Measurement Framework (2-page template) and adjust it for your use cases. Contact us to get the template and discuss how Manaira Labs can help you measure and scale AI value across your enterprise.